TABLE 10-17
A realtor wants to compare the mean sales-to-appraisal ratios of residential properties sold in four neighborhoods (A, B, C, and D) . Four properties are randomly selected from each neighborhood and the ratios recorded for each, as shown below.
A: 1.2, 1.1, 0.9, 0.4 C: 1.0, 1.5, 1.1, 1.3
B: 2.5, 2.1, 1.9, 1.6 D: 0.8, 1.3, 1.1, 0.7
Interpret the results of the analysis summarized in the following table:
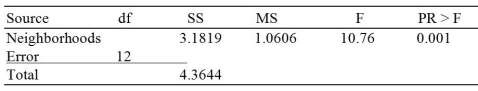
-Referring to Table 10-17, the within group sum of squares is ________.
Definitions:
Q8: Referring to Table 9-8, the lowest level
Q49: Referring to Table 10-3, what is(are)the critical
Q55: Referring to Table 10-5, the p-value of
Q89: Referring to Table 12-4, suppose the managers
Q110: A major DVD rental chain is considering
Q113: Referring to Table 10-2, what is the
Q157: The slope (b₁)represents<br>A) predicted value of Y
Q215: Referring to Table 10-2, the researcher was
Q218: Referring to Table 10-19, the value of
Q287: The variation attributable to factors other than