SCENARIO 18-10 Given below are results from the regression analysis where the dependent variable is the number of weeks a worker is unemployed due to a layoff (Unemploy) and the independent variables are the age of the worker (Age) , the number of years of education received (Edu) , the number of years at the previous job (Job Yr) , a dummy variable for marital status (Married: 1 = married, 0 = otherwise) , a dummy variable for head of household (Head: 1 = yes, 0 = no) and a dummy variable for management position (Manager: 1 = yes, 0 = no) .We shall call this Model 1.The coefficient of partial determination 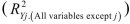 of each of the 6 predictors are, respectively, 0.2807, 0.0386, 0.0317, 0.0141, 0.0958, and 0.1201.
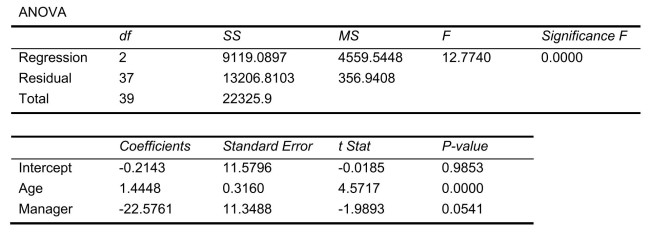
  Model 2 is the regression analysis where the dependent variable is Unemploy and the independent variables are Age and Manager.The results of the regression analysis are given below:
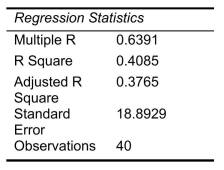
-Referring to Scenario 18-10 Model 1, which of the following is a correct statement?
Definitions:
High Quality
A characteristic of products or services that meet or exceed customer expectations or industry standards.
Low Cost
A strategy or pricing model that focuses on maintaining expenses as minimal as possible while still achieving the desired level of quality or service.
Instant Availability
The immediate accessibility of resources or services, often used in context with banking and funding.
Process Cost Accounting
An accounting methodology used for homogenous products that accumulates costs for each process or department and assigns them to units of output.
Q1: Referring to Scenario 20-1, if the probability
Q30: Referring to Scenario 20-6, the optimal strategy
Q59: Referring to Scenario 16-13, if a five-month
Q73: Which of the following finds relationships in
Q103: Referring to Scenario 20-6, what is the
Q104: _ is a procedure for revising probabilities
Q170: Referring to Scenario 18-10 Model 1, what
Q276: Referring to Scenario 18-10 and using both
Q282: An airline wants to select a computer
Q318: Referring to Scenario 18-1, one individual in