The figure given below shows the revenue and cost curves of a monopolistically competitive firm. Figure: 11.3 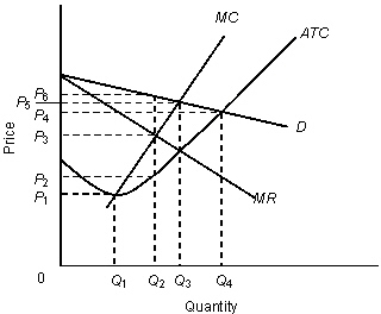 In the figure,
D: Demand curve
MR: Marginal revenue curve
MC: Marginal cost curve
ATC: Average total cost curve
-The profit per unit of output for the firm in the Figure 11.3 is:
Definitions:
Trade Restrictions
Measures implemented by governments to control the flow of goods and services across borders, which may include tariffs, quotas, and embargoes.
Domestic Producers
Domestic producers are companies that manufacture goods or provide services within their own country, often competing with imported products.
International Trade
The exchange of goods and services across national borders.
Free Trade Policy
An economic policy that allows imports and exports among member countries with no tariffs, quotas, or prohibitive regulations.
Q5: A perfectly competitive firm's pricing decision depends
Q17: When examining the costs of regulation to
Q27: Under perfect competition,the per unit revenue of
Q35: If,at the profit-maximizing level of output,a typical
Q60: A monopolist always produces on the elastic
Q71: A monopolistically competitive firm maximizes profit at
Q71: Refer to Figure 8.3.If the firm maximizes
Q83: The figure given below represents equilibrium in
Q91: According to Figure 10.8,the deadweight loss of
Q123: If market demand increases,a perfectly competitive firm