The figure given below shows the demand curves of two classes of buyers for tickets to a football match. Figure 10.4 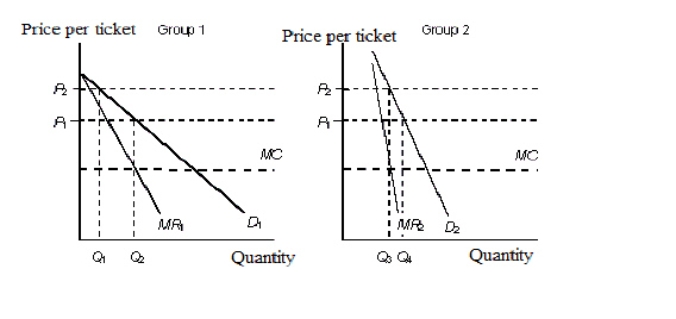
D1: Demand curve of group 1
D2: Demand curve of group 2
MR1: Marginal revenue of group 1
MR2: Marginal revenue of group 2
MC: Marginal cost
-Refer to Figure 10.4.What price must be charged to both the groups to maximize profits?
Definitions:
Social Pressure
involves the influence exerted by a social group on individuals to change their behaviors, beliefs, or attitudes.
Actual Pressure
The real or genuine force, influence, or stress exerted on someone or something.
Organizational Culture
Refers to the set of shared values, beliefs, and norms that influence the way employees think, feel, and behave within an organization.
Underrepresentation
The inadequate or disproportionately low representation of a particular group.
Q16: Economic profit includes all opportunity costs.
Q40: The demand curve for a product can
Q51: A(n) _ may offer products that are
Q59: Refer to Figure 12.1.Identify the fair-rate-of-return price.<br>A)P<sub>5</sub><br>B)P<sub>2</sub><br>C)P<sub>4</sub><br>D)P<sub>1</sub><br>E)P<sub>3</sub>
Q60: If the market price of the product
Q77: Refer to Table 7.2.If the production of
Q93: If a market is narrowly defined,the market
Q101: Wal-Mart created a competitive advantage with its
Q103: If losses are incurred in a competitive
Q107: Graphically,producer surplus is the area:<br>A)above the equilibrium