The figure given below shows the revenue and cost curves of a perfectly competitive firm. Figure 9.2 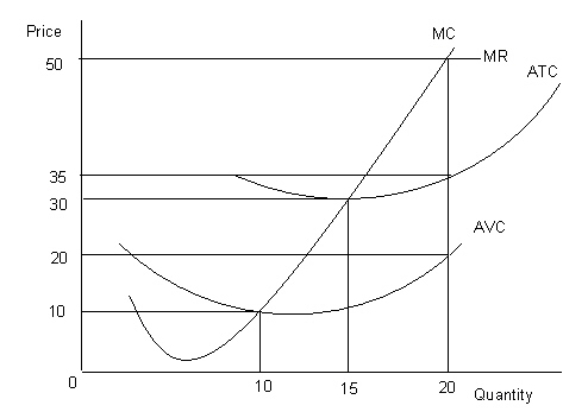
MC: Marginal cost curve
MR: Marginal revenue curve
ATC: Average-total-cost curve
AVC: Average-variable-cost curve
-Refer to Figure 9.2.What is the firm's total fixed cost at the profit-maximizing output level?
Definitions:
Income Statement
A financial statement that shows a company's revenues, expenses, and net income over a specific period.
Segment Margin
The amount of profit or loss generated by a specific division or segment of a company, expressed as a percentage of its revenues, highlighting the segment's operational efficiency and profitability.
Segmented Income Statement
An income statement broken down into segments such as product lines, geographical locations, or departments, to analyze performance.
Net Operating Income
Earnings from a company's core business operations, excluding deductions of interest and taxes.
Q11: Following a decrease in the price of
Q21: The addition to a business firm's total
Q28: In Figure 6.3,the consumer is in equilibrium
Q39: Refer to Figure 12.2.The regulation will benefit
Q79: As opposed to economists like Tinbergen and
Q90: Assume that one laborer produces 6 units
Q94: A perfectly competitive firm cannot affect the
Q97: In a price-leadership oligopoly model,the oligopoly firms
Q99: Perfect competition is the only market structure
Q132: As one moves downward on an indifference