Exhibit 12.5
The following questions use the information below.
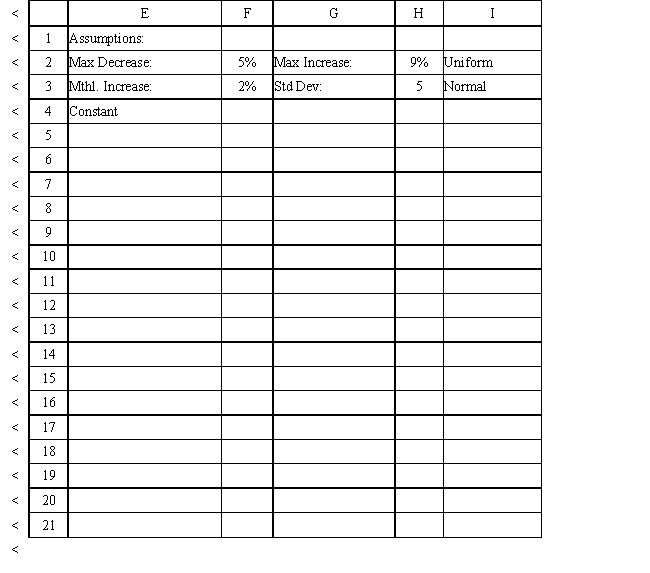
The owner of Sal's Italian Restaurant wants to study the growth of his business using simulation. He is interested in simulating the number of customers and the amount ordered by customers each month. He currently serves 1000 customers per month and feels this can vary uniformly between a decrease of as much as 5% and an increase of up to 9%. The bill for each customer is a normally distributed random variable with a mean of $20 and a standard deviation of $5. The average order has been increasing steadily over the years and the owner expects the mean order will increase by 2% per month. You have created the following spreadsheet to simulate the problem. 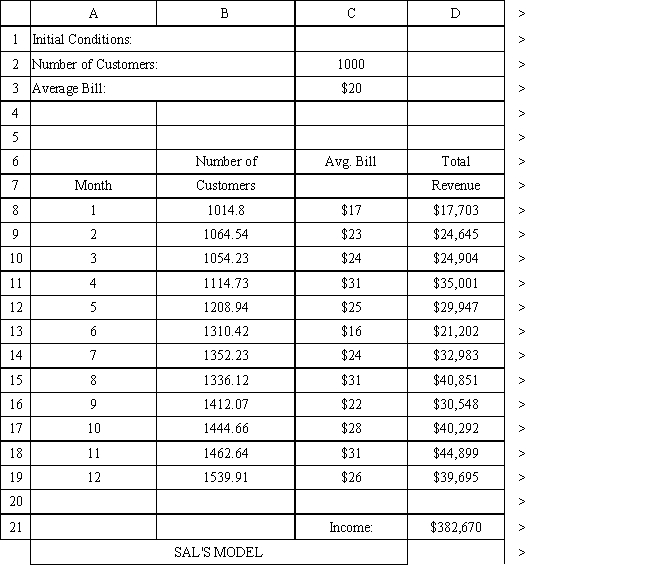
-What function should be used for generating random numbers between 1 and 12 from a continuous uniform distribution?
Definitions:
Pie Charts
A pie chart that uses slices to depict proportions of numbers.
Bar Charts
Visual representations that use bars to compare different categories or groups of data.
All-Nighters Narrative
An account or story about staying awake all night, typically to study or complete tasks.
Univariate Data
Data that consists of observations on only a single characteristic or attribute.
Q3: A grocery clerk can serve 20 customers
Q8: Refer to Exhibit 14.3. What decision should
Q8: What function should be used for generating
Q20: Latesha contributes a building with a FMV
Q20: Refer to Exhibit 10.1. What is the
Q28: To legally operate as a corporation in
Q28: A company wants to locate a new
Q58: On average, the differences between the actual
Q62: Bryan,Shahin,and Michele form a partnership.Bryan and
Q96: When a corporation is formed,if the sole