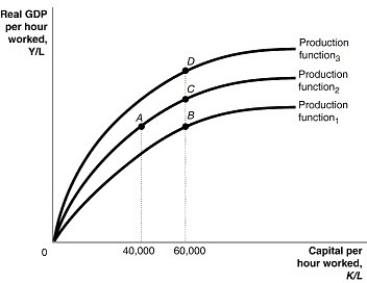
Figure 7.1  Alt text for Figure 7.1: In figure 7.1, a graph comparing capital per hour worked and real GDP per hour worked.
Long description for Figure 7.1: The x-axis is labelled, capital per hour worked, K/L, with values 40,000 and 60,000 marked.The y-axis is labelled, real GDP per hour worked, Y/L, with 0 at the vertex.3 concave curves, each originating from the vertex are shown.4 points A, B, C, and D are plotted such that point A has 40,000 as the x coordinate, and points B, C, and D have 60,000 as the x coordinate.The 3 curves pass through these points.The curve labelled, Production function 1, passes through point B.The curve labelled, Production function 2, passes through points A and C.The curve labelled, Production function 3, passes through point D.
-Refer to Figure 7.1.Using the per-worker production function in the figure above, the largest changes in an economy's standard of living would be achieved by a movement from
Definitions:
General Journal
A primary accounting record where all financial transactions are initially recorded, before being posted to specific accounts in the ledger.
Horizontal Analysis
A financial analysis technique that compares historical financial data over a series of reporting periods, using a base year as a comparison.
Vertical Analysis
A method of financial statement analysis in which each entry for each of the three major categories of accounts (assets, liabilities, and equities) in a balance sheet is represented as a proportion of the total account.
Percentage Analysis
A financial analysis technique that evaluates the proportion or percentage change of individual components in financial statements over time.
Q17: Georg,a German citizen,just purchased 10 shares of
Q30: According to Joseph Schumpeter,which of the factors
Q39: Firms in a small economy anticipated that
Q98: Which of the following government policies would
Q108: Refer to Figure 8.2.Suppose that the level
Q113: Actual investment spending includes spending by consumers
Q133: The quantity of goods and services that
Q174: Describe how a lender can lose during
Q208: Inflation usually increases during a recession and
Q307: The _ model focuses on the relationship