Several authors have tried to measure the "persistence" in U.S state unemployment rates by running the following regression: where ur is the state unemployment rate, i is the index for the i-th state, t indicates a time period, and typically k ? 10.
(a)Explain why finding a slope estimate of one and an intercept of zero is typically interpreted as evidence of "persistence."
(b)You collect data on the 48 contiguous U.S. states' unemployment rates and find the following estimates: = 2.25 + 0.60 × ; R2 = 0.40, SER = 0.90
(0.61)(0.13)
Interpret the regression results.
(c)Analyzing the accompanying figure, and interpret the observation for Maryland and for Washington. Do you find evidence of persistence? How would you test for it? 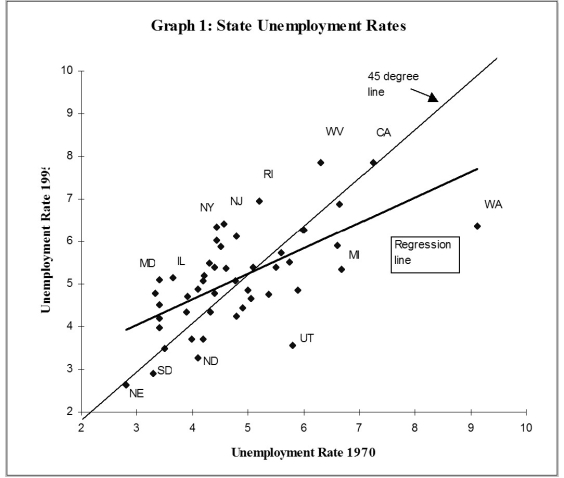 (d)One of your peers points out that this result makes little sense, since it implies that eventually all states would have identical unemployment rates. Explain the argument.
(e)Imagine that state unemployment rates were determined by their natural rates and some transitory shock. The natural rates themselves may be functions of the unemployment insurance benefits of the state, unionization rates of its labor force, demographics, sectoral composition, etc. The transitory components may include state-specific shocks to its terms of trade such as raw material movements and demand shocks from the other states. You specify the i-th state unemployment rate accordingly as follows for the two periods when you observe it, so that actual unemployment rates are measured with error. You have also assumed that the natural rate is the same for both periods. Subtracting the second period from the first then results in the following population regression function: It is not too hard to show that estimation of the observed unemployment rate in period t on the unemployment rate in period (t-k)by OLS results in an estimator for the slope coefficient that is biased towards zero. The formula is Using this insight, explain over which periods you would expect the slope to be closer to one, and over which period it should be closer to zero.
(f)Estimating the same regression for a different time period results in = 3.19 + 0.27 × ; R2 = 0.21, SER = 1.03
(0.56)(0.07)
If your above analysis is correct, what are the implications for this time period?
Definitions:
Internal Revenue Code
The comprehensive set of tax laws in the United States, enforced by the Internal Revenue Service (IRS).
Private Letter Rulings
Written decisions by the IRS in response to taxpayer requests for clarification on specific tax situations, binding only for the requesting taxpayer.
Temporary Regulations
Rules issued by government agencies for a limited period to address immediate issues or situations.
Revenue Ruling
An official interpretation by the IRS on how the law is applied to a specific set of facts.
Q2: The TSLS estimator is<br>A)consistent and has a
Q13: One of the least squares assumptions in
Q26: The following problems could be analyzed using
Q33: A causal effect for a single individual<br>A)can
Q42: A binary variable is often called a<br>A)dummy
Q44: The following two graphs give you a
Q47: Trying to remember the formula for the
Q56: When testing for differences of means,
Q57: The direct trade of goods and services
Q69: The Economic Report of the President