The following table shows the observed frequencies of the amount of assets under management for a sample of 134 hedge funds. The table also contains the hypothesized proportion of each class assuming the amount of assets under management has a normal distribution. The sample mean and standard deviation are 15 billion and 11 billion respectively. 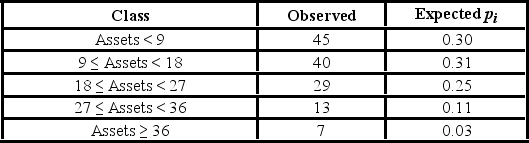 a. Set up the competing hypotheses for the goodness-of-fit test of normality for amount of assets under management.
B) Calculate the value of the test statistic and determine the degrees of freedom.
C) Specify the critical value at the 5% significance level.
D) Is there evidence to suggest the amount of assets under management do not have a normal distribution?
E) Are there any conditions that may not be satisfied?
Definitions:
Glass-Steagall Act
A law enacted in 1933 to separate commercial banking from investment banking, aimed at reducing conflicts of interest and preventing future financial crises.
Credentialed Public Accountant
A licensed accounting professional who has met certain education and experience requirements and passed a qualifying exam.
Q1: A police chief wants to determine if
Q5: Which of the following is not true
Q8: The fit of the regression equations <img
Q20: According to a recent survey, women chat
Q59: The heights (in cm) for a random
Q79: For a multinomial experiment, which of the
Q93: The following portion of regression results was
Q94: An investment analyst wants to examine the
Q98: Which of the following nonlinear regression models
Q108: Tiffany & Co. has been the world's