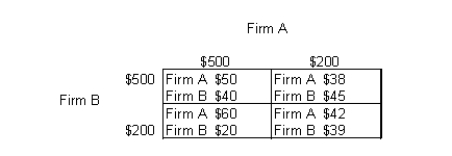
The table below shows the payoff (profit) matrix of Firm A and Firm B indicating the profit outcome that corresponds to each firm's pricing strategy (where $500 and $200 are the pricing strategies of two firms).Table 12.2

-In a price-leadership oligopoly model, the oligopoly firms engage in price wars.
Definitions:
Semiannual Interest
Interest that is calculated and paid twice a year, typically used in the context of bonds and loans.
Market Rate
The prevailing price or interest rate at which goods, services, or securities are bought and sold in a competitive marketplace.
Straight-Line Method
A method of calculating depreciation or amortization by evenly spreading the cost of an asset over its useful life.
Callable Bonds
Obligations that give the issuer the option to redeem them ahead of their final maturity, at a set price.
Q8: In Figure 12.2, assume that the average
Q30: According to Figure 14.6, what is the
Q46: Graphically, consumer surplus is the area:<br>A)above the
Q55: The quantity of labor supplied by a
Q62: If barriers to entry exist in the
Q67: The labor demand curve is based on
Q76: For a perfectly competitive firm the break-even
Q89: Refer to Figure 11.7. At the profit
Q91: Refer to Table 14.2. How many units
Q101: In Table 14.5, if the wage rate