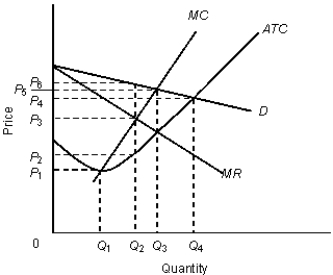
The figure given below shows the revenue and cost curves of a monopolistically competitive firm.Figure: 12.3
 In the figure,
D: Demand curve
MR: Marginal revenue curve
MC: Marginal cost curve
ATC: Average total cost curve
-The profit per unit of output for the firm in the Figure 12.3 is:
Definitions:
Diversity
The quality or state of having many different forms, types, ideas, or characteristics; often refers to the inclusion of people from various racial, ethnic, socio-economic, and demographic backgrounds.
Alternate Schedules
Various timetables or plans that alternate from the usual or expected pattern, often used in contexts like work, medication, or study plans.
Personality Traits
Enduring characteristics or qualities that define an individual's behavior across different situations.
Political Contexts
Refers to the political environment and circumstances within which events occur, affecting their outcomes and interpretations.
Q10: One of the reasons that communism failed
Q15: Assume that a firm's marginal revenue curve
Q19: In the market for resources, demand and
Q31: A firm under any market structure maximizes
Q42: What is the total social surplus prior
Q55: Refer to Figure 14.4. A competitive labor
Q68: Goods which are demanded to produce something
Q93: In the short-run, a monopolistically competitive firm:<br>A)can
Q107: A firm, such as a public utility,
Q108: In Figure 11.4, the demand curve D<sub>2</sub>:<br>A)has