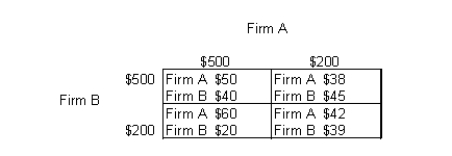
The table below shows the payoff (profit) matrix of Firm A and Firm B indicating the profit outcome that corresponds to each firm's pricing strategy (where $500 and $200 are the pricing strategies of two firms) .Table 12.2

-Which of the following is an example of a positive externality?
Definitions:
Average-Total-Cost Curve
A graphical representation showing how the average total cost of producing a good changes as the quantity produced changes.
Average-Fixed-Cost
The fixed costs of production divided by the quantity of output produced; it decreases as production increases.
Average-Variable-Cost
The total variable cost divided by the quantity of output produced.
Marginal Costs
The investment required to manufacture an incremental unit of a product or service.
Q2: Forcing members of a group into certain
Q6: A college student's choice of a major
Q19: In the market for resources, demand and
Q20: In contrast to both perfect competition and
Q34: Refer to Figure 10.7 and calculate the
Q50: Which of the following is not a
Q70: Under the second phase of antitrust policy
Q77: According to Figure 17.2, what sort of
Q101: In monopolistic competition, firms may differentiate their
Q112: Suppose that ABC Industries, a perfectly competitive