Refer to the following figure when answering the next two questions.
Figure 17.2: Dow Jones Industrial Average: 2000-2012 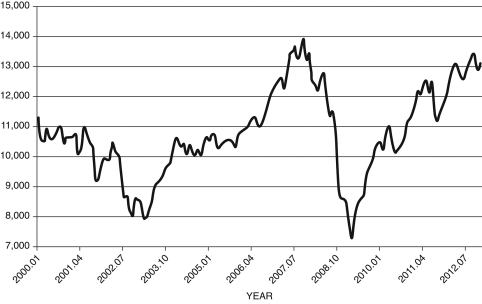
(Source: Federal Reserve Economic Data, St. Louis Federal Reserve)
-Your uncle asks you to explain stock prices based on the financial capital arbitrage equation. He shows you the graph shown in Figure 17.2. He asks you to explain the cause in the rise of stock prices for the years 2002-2006. What do you tell him?
Definitions:
Artificially High Amounts
Figures or values that have been inflated through accounting practices or activities that do not reflect the true economic value or performance.
Consolidated Financial Statements
Financial statements that aggregate the financial information of a parent company and its subsidiaries, presenting it as if the group were a single entity.
Gross Profit
The financial gain obtained after subtracting the cost of goods sold from the total revenue generated from sales.
Voting Stock
Shares that give the shareholder the right to vote on company matters, such as electing directors or approving corporate policies.
Q12: If the economy grows faster than the
Q29: According to the Taylor rule, the federal
Q33: Your grandmother is a follower of the
Q38: If the savings interest rate rises, to
Q45: If there is an appreciation of the
Q53: Adding the financial friction to the AS/AD
Q61: Consider Figure 20.3. If the economy initially
Q71: If <span class="ql-formula" data-value="\bar {
Q78: If moving an extra unit of today's
Q91: If the government increases its budget deficit,