Exhibit 18.3.The following table shows the annual revenues (in millions of dollars) of a pharmaceutical company over the period 1990-2011. 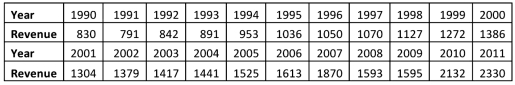
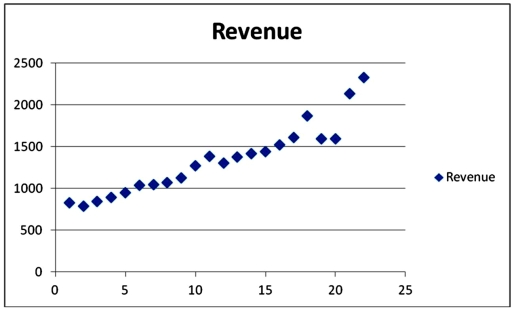 Excel scatterplot shown above indicates that the annual revenues have an increasing trend.Therefore,linear,exponential,quadratic and cubic models were used to fit the trend,and the following relevant information became available after applying linear regression.
 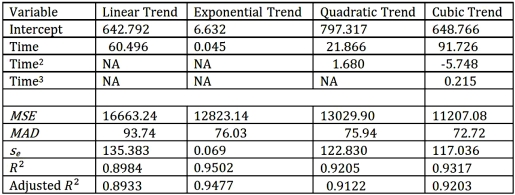 Refer to Exhibit 18.3.What is a revenue forecast for 2012 found by the polynomial trend equation with the best fit?
Definitions:
Q12: An example of individual racism is<br>A)racism that
Q15: Exhibit 19-2.Hugh Wallace has the following information
Q17: Poorhouse occupants were most often<br>A)those who were
Q32: One-Way ANOVA analyzes the effect of one
Q38: Exhibit 15-1.An marketing analyst wants to examine
Q41: Exhibit 20.1.A pawn shop claims to sell
Q50: When estimating a multiple regression model based
Q55: Exhibit 17.4.A researcher wants to examine how
Q56: Exhibit 14-3.Consider the following sample regression equation
Q98: Katie Jones started her career with an