Exhibit 17.8.A realtor wants to predict and compare the prices of homes in three neighboring locations.She considers the following linear models:
Model A: Price = β0 + β1Size + β2Age + ε,
Model B: Price = β0 + β1Size + β2Loc1 + β3Loc2 + ε,
Model C: Price = β0 + β1Size + β2Age + β3Loc1 + β4Loc2 + ε,
where,
Price = the price of a home (in $thousands),
Size = the square footage (in square feet),
Loc1 = a dummy variable taking on 1 for Location 1,and 0 otherwise,
Loc2 = a dummy variable taking on 1 for Location 2,and 0 otherwise.
After collecting data on 52 sales and applying regression,her findings were summarized in the following table. 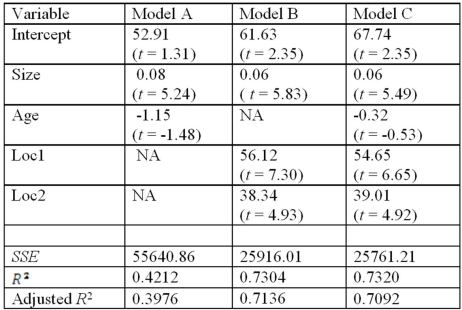 Note: The values of relevant test statistics are shown in parentheses below the estimated coefficients.
Refer to Exhibit 17.8.Which of the three models would you choose to make the predictions of the home prices?
Definitions:
Risk Sharing and Transfer Agreements
Contracts where two or more parties agree to distribute among themselves the losses or benefits arising from particular risks.
Monte Carlo Simulation
A computational algorithm that uses repeated random sampling to obtain numerical results, typically used to assess risk and uncertainty in prediction and modeling.
Contingency Funds
Reserved money set aside by organizations or projects to address unforeseen events or emergencies that may incur additional costs.
Risk Profile
A risk profile is a quantified analysis of the types of threats an organization, asset, project, or individual faces, focusing primarily on the risk exposure level.
Q13: Exhibit 20.8.A sports agent wants to understand
Q35: In a simple linear regression model,if the
Q41: Asians,Hispanics,and African Americans grow up in families
Q43: Exhibit 18.2.The following table includes the information
Q46: A manager at a local bank analyzed
Q55: Consider the following table providing the prices
Q68: Exhibit 17.1.A researcher has developed the following
Q79: The number of dummy variables representing a
Q87: In the estimation of a multiple regression
Q90: Exhibit 12.4 In the following table,likely voters'