Exhibit 12.7 The heights (in cm) for a random sample of 60 males were measured.The sample mean is 166.55,the standard deviation is 12.57,the sample kurtosis is 0.12,and the sample skewness is -0.23.The following table shows the heights subdivided into non-overlapping intervals. 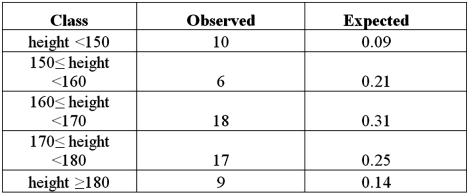 Refer to Exhibit 12.7.The heights are subdivided into five intervals.The degrees of freedom for the goodness-of-fit test for normality is:
Definitions:
Double Exponential Smoothing
A forecasting method that applies exponential smoothing twice, useful in capturing trends and seasonality in data.
Exponential Smoothing Model
A forecasting technique that applies decreasing weights to past observations as they recede into the past.
Level Significance
The probability of rejecting the null hypothesis in a statistical test when it is actually true, typically denoted as alpha (α).
Q3: A statistics instructor wants to examine the
Q7: Exhibit 16.6.Thirty employed single individuals were randomly
Q8: Exhibit 16-7.It is believed that the sales
Q9: The parameter of interest for inferences regarding
Q27: The variance of the rates of return
Q30: A large city recently surveyed 1,354 street
Q36: It is preferable to place the smaller
Q40: Exhibit 10.3.A restaurant chain has two locations
Q57: Exhibit 16-7.It is believed that the sales
Q71: In a multiple regression based on 30