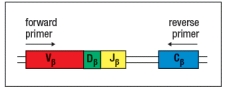
T-cell receptor spectratype analysis is used to examine the diversity of T-cell receptor chain sequences in an individual's T cells. For this technique, T cells are isolated from a sample of thymocytes (developing T cells) or mature peripheral T cells from an individual. The mRNA is isolated from these cells and cDNA is generated by reverse transcription. This pool of cDNA is mixed with PCR primers that are used to amplify part of the rearranged T-cell receptor chain sequence containing the complete CDR3. The position of these primers relative to the rearranged T-cell receptor chain gene in the DNA locus is shown in Figure. Following the PCR amplification, the heterogeneous mixture of DNA molecules is then size-separated by electrophoresis on an apparatus that can separate molecules that differ by a single nucleotide. At the end, the quantity of material deposited in each band of a given nucleotide sequence length is quantified by densitometry, and the spectratype trace is produced. The x-axis of the spectratype depicts the number of nucleotides in each PCR product from the beginning of the forward primer to the end of the reverse primer.
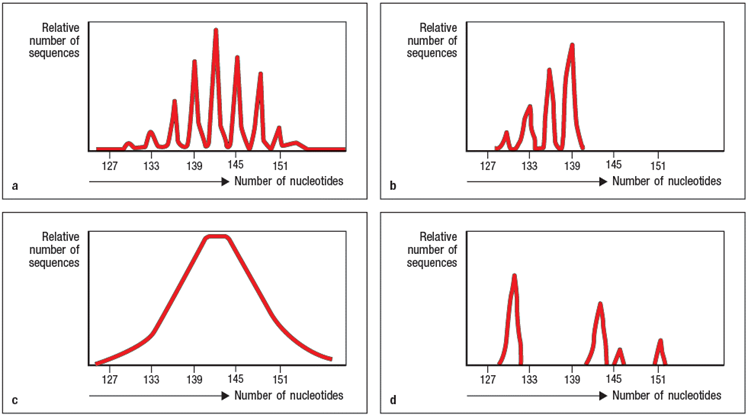
a) Panel A of Figure shows the spectratype trace of mature peripheral T cells from a healthy individual. What is explanation for the separation of the heterogeneous population of T-cell receptor chain sequences into multiple sharp peaks of size lengths?
b) Panel B shows T cells from an individual that is missing an important enzyme that contributes to T-cell receptor chain diversity during the recombination process. Which enzyme is most likely absent in this individual?
c) Panel C shows the spectratype analysis of T-cell receptor chain sequences in developing T cells that have just completed the V-D-J recombination process. Explain why this spectratype looks different from the one shown in panel A.
d) Panel D shows a more restricted example of spectratype analysis, where the forward primer used only binds to one specific V sequence. In this example, the primer is specific for V 17. When such a V -specific primer is used, the spectratype analysis only shows the junctional sequence lengths for T cells whose chain uses V 17. In a healthy individual, the V 17 spectratype would like just like the one shown in panel A; in other words, it would show a random distribution of V 17+ T-cell receptor chains with a normal distribution of junctional lengths.
However, in this case, the individual being studied has been infected with influenza virus, and is in the midst of a robust T cell response against the virus. What is the likely explanation for the non-random pattern of peaks on the V 17 spectratype from this individual at this timepoint?
Definitions:
Comprehensive Message
A message that is thorough and fully covers a topic, leaving no relevant part unaddressed.
Punctuation
The use of symbols such as commas, periods, and question marks in writing to clarify meaning and indicate pauses or intonation.
Visual Impact
The effect or influence visual elements have on a viewer's perception and reaction to a specific design, environment, or brand.
North American Style
Refers typically to business or cultural practices, language usage, or architectural styles prevalent in North America.
Q6: This molecule is expressed on activated endothelium,is
Q9: Reovirus is an enteric virus that
Q12: Effective vaccines have been developed against a
Q15: A mutant mouse line (Mutant-X) is discovered
Q20: Based on these data, Fc
Q37: The first drug treatment for HIV licensed
Q44: You are trying to decide in which
Q46: To find the expected frequency in a
Q49: Recently, students in a marketing research class
Q116: i. chi-square test statistic used in a