Exhibit 12.5
The following questions use the information below.
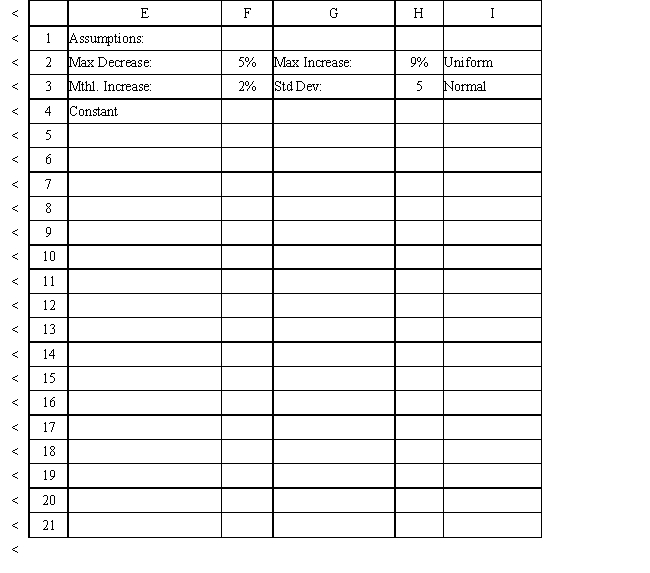
The owner of Sal's Italian Restaurant wants to study the growth of his business using simulation. He is interested in simulating the number of customers and the amount ordered by customers each month. He currently serves 1000 customers per month and feels this can vary uniformly between a decrease of as much as 5% and an increase of up to 9%. The bill for each customer is a normally distributed random variable with a mean of $20 and a standard deviation of $5. The average order has been increasing steadily over the years and the owner expects the mean order will increase by 2% per month. You have created the following spreadsheet to simulate the problem. 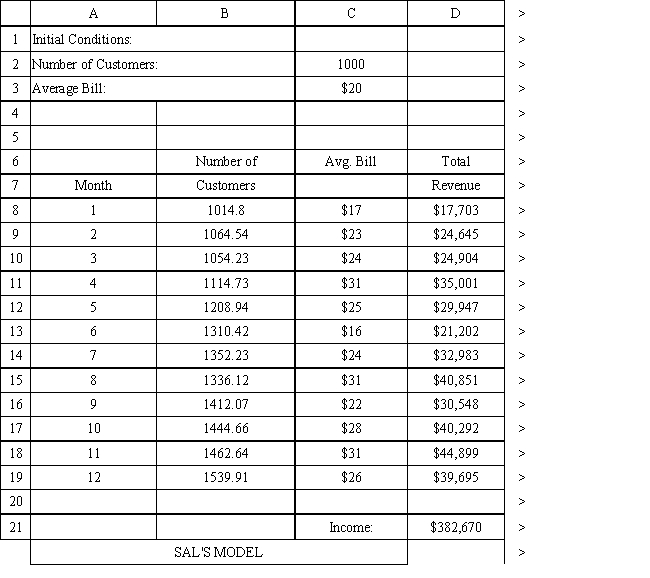
-Which of the following best describes queuing theory?
Definitions:
First-Price Auction
A bidding system where the item is awarded to the top bidder at the price they offered.
True Values
The actual, inherent worth or significance of something, often in a context where this may not be initially apparent.
Selling Price
The amount of money for which a product or service is sold to the consumer.
First-Price Auction
An auction format in which the highest bidder wins the item and pays the price they bid.
Q8: To prevent serious stalking outcomes, the victim
Q15: According to analysis of 2005 through 2010
Q17: If the following project must be completed
Q24: Currently, courts in every state have the
Q26: Refer to Exhibit 11.7. What formula should
Q28: Refer to Exhibit 10.5. Based on the
Q57: A company wants to locate a new
Q62: A technique that analyzes past behavior of
Q101: Refer to Exhibit 11.24. Based on the
Q113: A payoff matrix is a table that