The figure below shows the demand and supply curves in the market for elementary education. Figure 13.1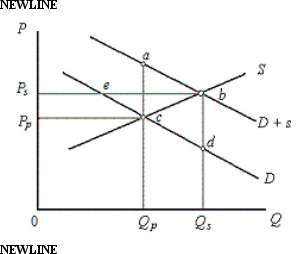 In the figure,
D: Private demand curve for elementary education
D + s: Demand curve which includes public benefits
S: Supply curve of education
Price and Quantity have been taken on vertical and horizontal axes respectively.
Figure 13.1 represents a situation of:
Definitions:
Supplier Risk
The potential for negative impacts to a company's operations, profitability, or reputation resulting from its suppliers' actions or inactions.
Strategic Purchase
The acquisition of goods or services that are vital to a company's operations or strategy, often involving significant expenditure and planning.
Environmental Sustainability
The practice of using resources in a way that does not deplete them and conserves the natural environment for future generations.
Community Development
Initiatives designed to improve the living conditions, economy, and social cohesion within a specific area or community.
Q2: Which of the following is not a
Q3: The figure given below shows the revenue
Q9: Because of their derived nature, resource markets
Q20: A deadweight loss arises under perfect competition.
Q24: If a hydel power plant expects the
Q25: If a market becomes deregulated and is
Q80: Scenario 28.1 A worker in Firm A
Q81: The objective of creating a brand name
Q83: Suppose that the current price of a
Q102: If a firm is able to collect