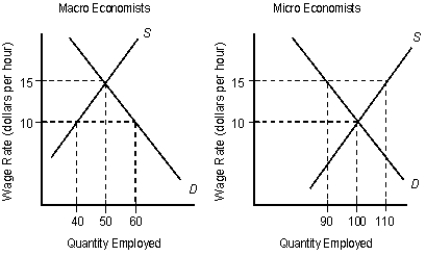
The following figures show the demand (D) and supply (S) curves of micro and macro economists.Figure 16.6

-From an economist's viewpoint, discrimination occurs if there is a wage differential between two groups when there is no difference in the marginal revenue product of the two groups.
Definitions:
Return on Equity
A measure of the profitability of a business in relation to the equity, indicating how effectively equity is used to generate profits.
Total Stockholders' Equity
The total amount of funds contributed by investors and the accumulated earnings of a company, less any dividends paid.
Net Operating Income
A financial metric that calculates a company's profitability by subtracting operating expenses from operating revenues.
Book Value Per Share
A financial measure that calculates a company's net asset value divided by the number of outstanding shares.
Q18: Scenario 13.1 Assume the following conditions hold.<br><img
Q32: The figure given below represents equilibrium in
Q33: Which of the following are benefits created
Q38: The Phillips curve based on the unemployment
Q70: Monetarists believe that changes in monetary policy
Q74: Burger King has a direct demand for
Q90: Poverty is usually defined by economists in
Q111: The figure given below represents equilibrium in
Q133: If the FOMC purchases government bonds priced
Q141: In the figure given below panel A