A researcher studies the relationship between SAT scores,the test-taker's family income,and his or her grade point average (GPA) .Data are collected from 24 students.He estimates the following model: SAT = β0 + β1 GPA + β2 Income + ε.The following table summarizes a portion of the regression results. 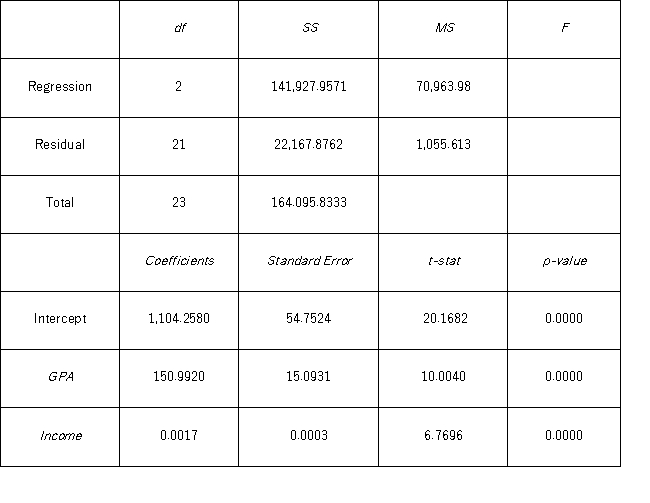 At the 5% significance level,which of the following explanatory variable(s) is(are) individually significant?
Definitions:
Hispanic-Americans
Americans with ancestry from Spanish-speaking countries, especially those in Latin America.
African-Americans
A racial or ethnic group in the United States with ancestry from the black racial groups of Africa.
Native Americans
Indigenous peoples of the United States, including various tribes, who were the original inhabitants of the land prior to European colonization.
Genome
The complete set of genes or genetic material present in a cell or organism.
Q19: A right-tailed test for the ratio of
Q33: The following Excel scatterplot with the fitted
Q43: A researcher studies the relationship between SAT
Q58: Although a polynomial regression model of order
Q89: The calculation of the Jarque-Bera test statistic
Q93: Which of the following violates the assumptions
Q104: When the predicted value of the response
Q110: A scatterplot can help determine if two
Q110: It is believed that the sales volume
Q135: In the sample regression equation <img src="https://d2lvgg3v3hfg70.cloudfront.net/TB4266/.jpg"