You have read about the so-called catch-up theory by economic historians,whereby nations that are further behind in per capita income grow faster subsequently.If this is true systematically,then eventually laggards will reach the leader.To put the theory to the test,you collect data on relative (to the United States)per capita income for two years,1960 and 1990,for 24 OECD countries.You think of these countries as a population you want to describe,rather than a sample from which you want to infer behavior of a larger population.The relevant data for this question is as follows: 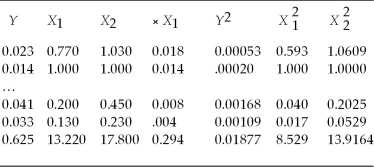 where X1 and X2 are per capita income relative to the United States in 1960 and 1990 respectively,and Y is the average annual growth rate in X over the 1960-1990 period.Numbers in the last row represent sums of the columns above.
(a)Calculate the variance and standard deviation of X1 and X2.For a catch-up effect to be present,what relationship must the two standard deviations show? Is this the case here?
(b)Calculate the correlation between Y and .What sign must the correlation coefficient have for there to be evidence of a catch-up effect? Explain.
Definitions:
Production Possibilities
outlines the different combinations of goods and services that an economy can produce, given its available resources and technology.
Autos
Short for automobiles, referring to motor vehicles designed for transporting passengers on roads.
Comparative Advantage
The ability of an individual or group to produce a good or service at a lower opportunity cost than others, leading to more efficient trade possibilities.
Production Possibility
A graph showing the highest possible production levels of two items, using a specific combination of resources and various factors.
Q24: Your textbook discussed the regression model when
Q27: Your textbook derives the OLS estimator as
Q28: The components of internal validity are<br>A)a large
Q30: (Requires Matrix Algebra)Consider the time and entity
Q33: You need to adjust <img src="https://d2lvgg3v3hfg70.cloudfront.net/TB2833/.jpg" alt="You
Q38: What role does the concept of cointegration
Q49: In order to calculate the regression R2
Q53: Let Y be a Bernoulli random variable
Q54: In the presence of heteroskedasticity,and assuming that
Q64: You have learned in one of your