Table 5.3
King Supply makes four different types of plumbing fixtures: W, X, Y and Z. The contribution margins for these products are: $70 for Product W, $60 for Product X, $90 for Product Y and $100 for Product Z. Fixed overhead is estimated at $5,500 per week. The manufacture of each fixture requires four machines, Machines #1, 2, 3 and 4. Each of the machines is available for 40 hours a week and there is no setup time required when shifting from the production of one product to any other. The processing requirements to make one unit of each product are shown in the table. Weekly product demand for the next planning period has been forecasted as follows: 70 Ws, 60 Xs, 50 Ys and 30 Zs.
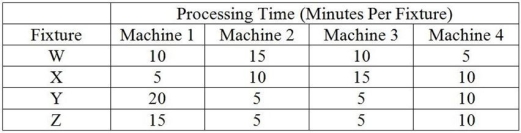
In the questions that follow, the traditional method refers to maximizing the contribution margin per unit for each product, and the bottleneck method refers to maximizing the contribution margin per minute at the bottleneck for each product.
-Use the information in Table 5.3. Using the bottleneck method, what is the optimal product mix?
Definitions:
Brand Name
A distinctive name identifying a product, service, or company, often acting as a signifier of quality and reliability.
Economic Profit
The profit a firm or individual makes after deducting both explicit and implicit costs.
Imperfect Substitutes
Goods or services that can replace each other to some extent, but have differences in features, quality, or price that make them not completely interchangeable.
Brand Names
Names given to products or services by companies to distinguish them from competitors.
Q37: What is a Drum-Buffer-Rope system for planning
Q57: The Japanese term for continuous improvement in
Q69: Consider the following data concerning the performance
Q72: Capacity is the maximum rate of output
Q79: Use the information in Table 5.3.Using the
Q80: Using Table 7.9,what is the difference,in dollars,between
Q80: If demand is increasing,and you also prefer
Q95: Consider consecutive processes A-B-C,where process A has
Q105: _ is the documentation and detailed understanding
Q145: Construct a 3-sigma x-bar chart for the