Multiple Choice
Look at the utility function graphed below and select the type of decision maker that corresponds to the graph. 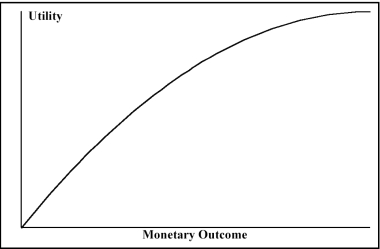
Definitions:
Related Questions
Q8: Referring to Table 16-13, in testing the
Q33: Referring to Table 2-16, roughly what percentage
Q45: Referring to Table 2-12,_ percent of the
Q96: Referring to Table 17-1, if the probability
Q114: In graphing bivariate categorical data, the side-by-side
Q125: Percentage polygons are plotted at the boundaries
Q137: The Z score of an observation measures
Q143: Which of the following is not an
Q144: Referring to Table 14-5, what is the
Q192: Referring to Table 16-8, the fitted trend