TABLE 13-12
The manager of the purchasing department of a large saving and loan organization would like to develop a model to predict the amount of time (measured in hours) it takes to record a loan application. Data are collected from a sample of 30 days, and the number of applications recorded and completion time in hours is recorded. Below is the regression output:
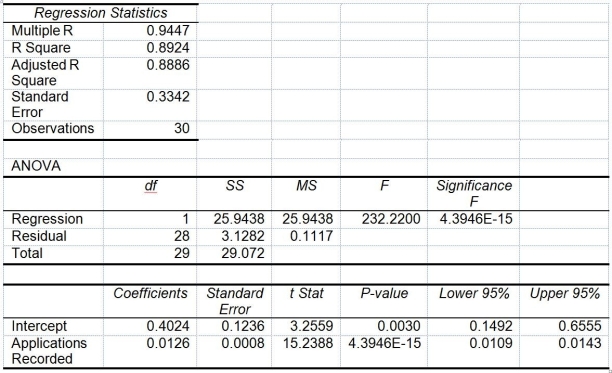
Note: 4.3946E-15 is 4.3946 ×

-Referring to Table 13-12, you can be 95% confident that the mean amount of time needed to record one additional loan application is somewhere between 0.0109 and 0.0143 hours.
Definitions:
Probability Of Occurrence
The likelihood of an event happening, measured on a scale from 0 (impossibility) to 1 (certainty).
Span Of Time
The duration or extent between two points in time.
Poisson Random Variable
A type of random variable that represents the number of events occurring in a fixed interval of time or space, under the condition that these events happen with a known constant mean rate and independently of the time since the last event.
Probability Distribution
A probability distribution is a statistical function that describes all the possible values and likelihoods that a random variable can take within a given range.
Q4: Referring to Table 12-11, the decision made
Q14: Referring to 14-16, the 0 to 60
Q37: If you wanted to find out if
Q57: Referring to Table 11-8, the randomized block
Q104: Referring to Table 13-11, there appears to
Q141: Referring to Table 12-11, the same decision
Q190: Referring to Table 13-5, the value of
Q191: Referring to Table 12-13, the value of
Q348: Referring to Table 14-11, what null hypothesis
Q351: Referring to Table 14-15, what is the