The qualitative graph below shows the molecular changes accompanying vernalization in the flowering plant Arabidopsis thaliana. Indicate which curve (A to D) in the graph better represents the temporal changes in each of the following variables. Your answer would be a four-letter string composed of letters A to D only, with each letter used once, e.g. BACD.
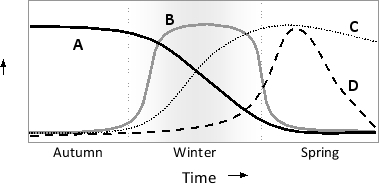
( ) Level of Coolair noncoding RNA
( ) Level of Flowering locus C (FlC) gene product (transcriptional repressor)
( ) Level of Flowering locus T (Ft) gene product (transcriptional activator)
( ) Level of repressive chromatin marks at the FlC locus
Definitions:
Shortage
A situation in which the demand for a product or service exceeds the supply available at a particular price.
Non-price Factors
Variables other than price that affect the demand and supply of goods and services, such as consumer preferences, income, and technology.
Price Ceiling
A legal maximum price that can be charged for a good or service, intended to protect consumers from high prices.
Quantity Supplied
Quantity supplied refers to the total amount of a good or service that producers are willing and able to sell at a given price over a specific time period.
Q5: Each is true of retinoic acid,except one.Which
Q14: How is Cdc20-APC/C similar to Cdh1-APC/C?<br>A) They
Q16: Indicate true (T) and false (F) statements
Q17: If this protein is unable to hydrolyze
Q19: During the Krebs cycle,complete aerobic oxidation of
Q22: The biological function that plants use to
Q28: A patient with persisting larger-than-normal lymph nodes
Q48: Platelets that express a constitutively active Rap1
Q50: A certain effector protein can be activated
Q56: Which of the cell types A to