Exhibit 12.3
The following questions use the information below.
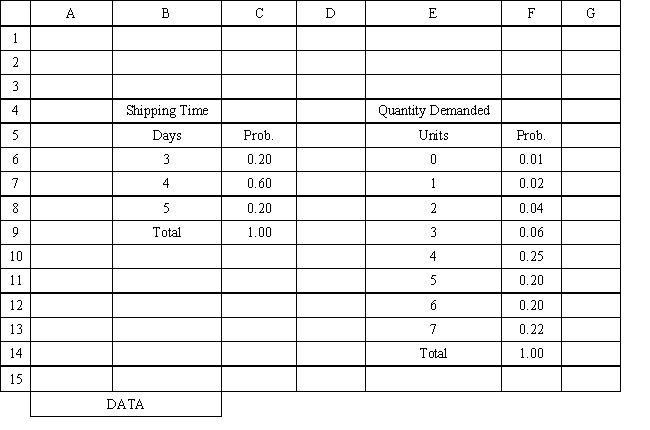
An auto parts store wants to simulate its inventory system for engine oil. The company has collected data on the shipping time for oil and the daily demand for cases of oil. A case of oil generates a $10 profit. Customers can buy oil at any auto parts store so there are no backorders (the company loses the sale and profit) . The company orders 30 cases whenever the inventory position falls below the reorder point of 15 cases. Orders are placed at the beginning of the day and delivered at the beginning of the day so the oil is available on the arrival day. An average service level of 99% is desired. The following spreadsheets have been developed for this problem. The company has simulated 2 weeks of operation for their inventory system. The current level of on-hand inventory is 25 units and no orders are pending. 
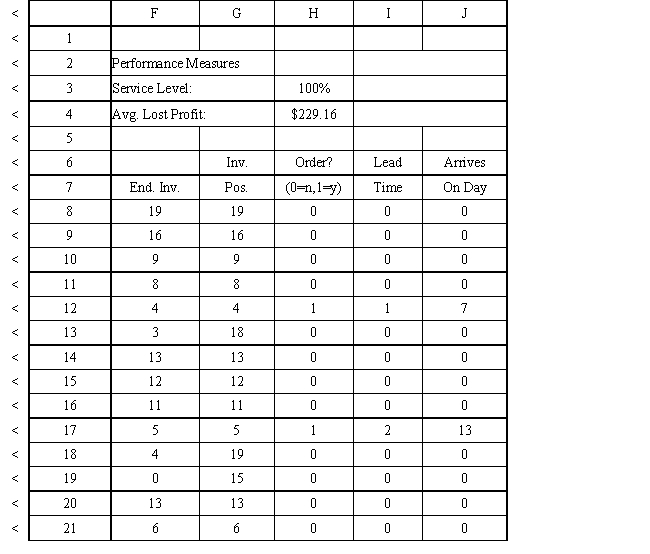
-The average demand is 4.45 cases per day. Using the information in Exhibit 12.3, what formula should go in cell H4 to determine the average lost sales?
Definitions:
Scatter Plot
A type of graph or plot which uses Cartesian coordinates to display values for typically two variables for a set of data.
45° Angle
A 45° angle is a measure of angle equal to half of a right angle, commonly encountered in geometry and trigonometry.
Basis For Prediction
The underlying data or rationale upon which a prediction is made.
Correlation
A numeric indicator that shows the degree to which two or more variables change in relation to each other.
Q11: Refer to Exhibit 10.5. What formulas should
Q19: In 2016,Angel contributes land to a partnership
Q25: The AMT tax rate for individuals is
Q25: A simulation model was replicated 100 times
Q27: Using the information in Exhibit 12.3, what
Q39: An investor has $500,000 to invest and
Q57: Using the information in Exhibit 12.3, what
Q63: A city wants to locate 2 new
Q66: Andre formed a corporation and owns all
Q88: Refer to Exhibit 11.1. What formula should