There is some evidence that the Phillips curve has been unstable during the 1962 to 1999 period for the United States, and in particular during the 1990s. You set out to investigate whether or not this instability also occurred in other places. Canada is a particularly interesting case, due to its proximity to the United States and the fact that many features of its economy are similar to that of the U.S.
(a)Reading up on some of the comparative economic performance literature, you find that Canadian unemployment rates were roughly the same as U.S. unemployment rates from the 1920s to the early 1980s. The accompanying figure shows that a gap opened between the unemployment rates of the two countries in 1982, which has persisted to this date. 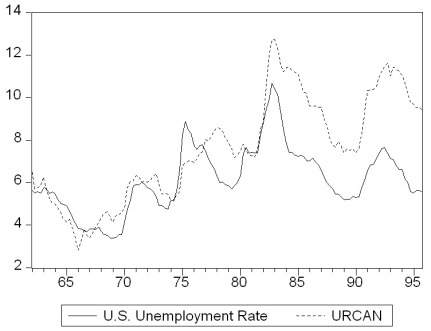 Inspection of the graph and data suggest that the break occurred during the second quarter of 1982. To investigate whether the Canadian Phillips curve shows a break at that point, you estimate an ADL(4,4)model for the sample period 1962:I-1999:IV and perform a Chow test. Specifically you postulate that the constant and coefficients of the unemployment rates changed at that point. The F-statistic is 1.96. Find the critical value from the F-table and test the null hypothesis that a break occurred at that time. Is there any reason why you should be skeptical about the result regarding the break and using the Chow-test to detect it?
(b)You consider alternative ways to test for a break in the relationship. The accompanying figure shows the F-statistics testing for a break in the ADL(4,4)equation at different dates. 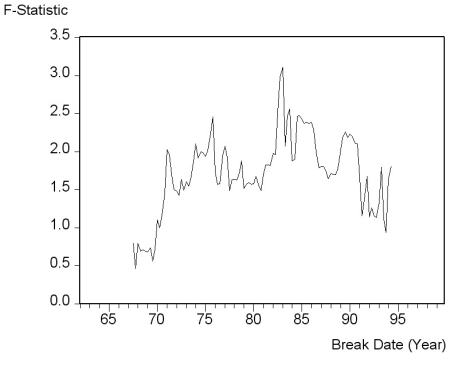 The QLR-statistic with 15% trimming is 3.11. Comment on the figure and test for the hypothesis of a break in the ADL(4,4)regression.
(c)To test for the stability of the Canadian Phillips curve in the 1990s, you decide to perform a pseudo out-of-sample forecasting. For the 24 quarters from 1994:I-1999:IV you use the ADL(4,4)model to calculate the forecasted change in the inflation rate, the resulting forecasted inflation rate, and the forecast error. The standard error of the ADL(4,4)for the estimation sample period 1962:1-1993:4 is 1.91 and the sample RMSFE is 1.70. The average forecast error for the 24 inflation rates is 0.003 and the sample standard deviation of the forecast errors is 0.82. Calculate the t-statistic and test the hypothesis that the mean out-of-sample forecast error is zero. Comment on the result and the accompanying figure of the actual and forecasted inflation rate. 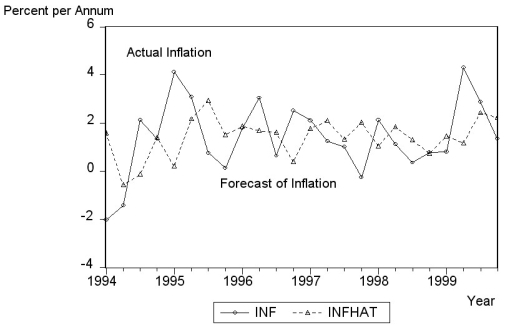
Definitions:
Wired Network
A network in which computers and other devices are connected to each other and to the internet or another network via physical cables.
Central Server
A primary server in a network that manages services for the networked computers, facilitating centralized data management and access.
Star Network
A network topology in which all nodes are individually connected to a central connection point, like spokes on a wheel, facilitating better manageability and fault tolerance.
Bus
A high-speed internal connection within a computer or between computers and peripherals, used for data transfer.
Q13: (Requires Matrix Algebra)Consider the time and
Q15: The conditions for a valid instruments do
Q23: One implication of the extended least
Q26: There is some evidence that the Phillips
Q26: In the multiple regression model with
Q27: In the multiple regression model with
Q28: Simultaneous causality bias<br>A)is also called sample selection
Q36: Consider the following two models to explain
Q40: In the distributed lag model, the coefficient
Q46: Consider the following model Y<sub>t</sub> =